The math behind PPC dominance: a data‑driven study of “The Power Law of CRO”
(By the way, to get articles like this free in your inbox, subscribe to our newsletter.)
The Power Law of CRO is one of our most popular articles. If you’ve read it, you’ll already know that Conversion Rate Optimization delivers more customers (for free) and dramatically increases profits—but have you fully considered its astounding second-order effects?
Here’s Chris Morling, Founder & Managing Director of our client, Money.co.uk:
“The biggest impact was on our PPC activity—Google Ads, Bing, etc. The increases in conversion made it possible for us to buy more traffic and negotiate better commercial deals with advertisers, which had a direct impact on our bottom line.”
In other words, CRO doesn’t just increase profits, it increases the ability to further increase profits.
In this article, we’ll dig deeper into Benefit 3 of the Power Law of CRO, the idea that CRO can open up floods of traffic for your business and help you dominate your market. Here’s what we said about Benefit 3:
Benefit 3: CRO opens up floods of trafficOnce your conversion rate has increased, you’re more profitable. It pays to sacrifice some of that profit into increasing your advertising bid prices—which can dramatically increase your number of customers. You can outbid your competitors and profitably dominate all the advertising space in your market.
The power of increasing your conversion rate
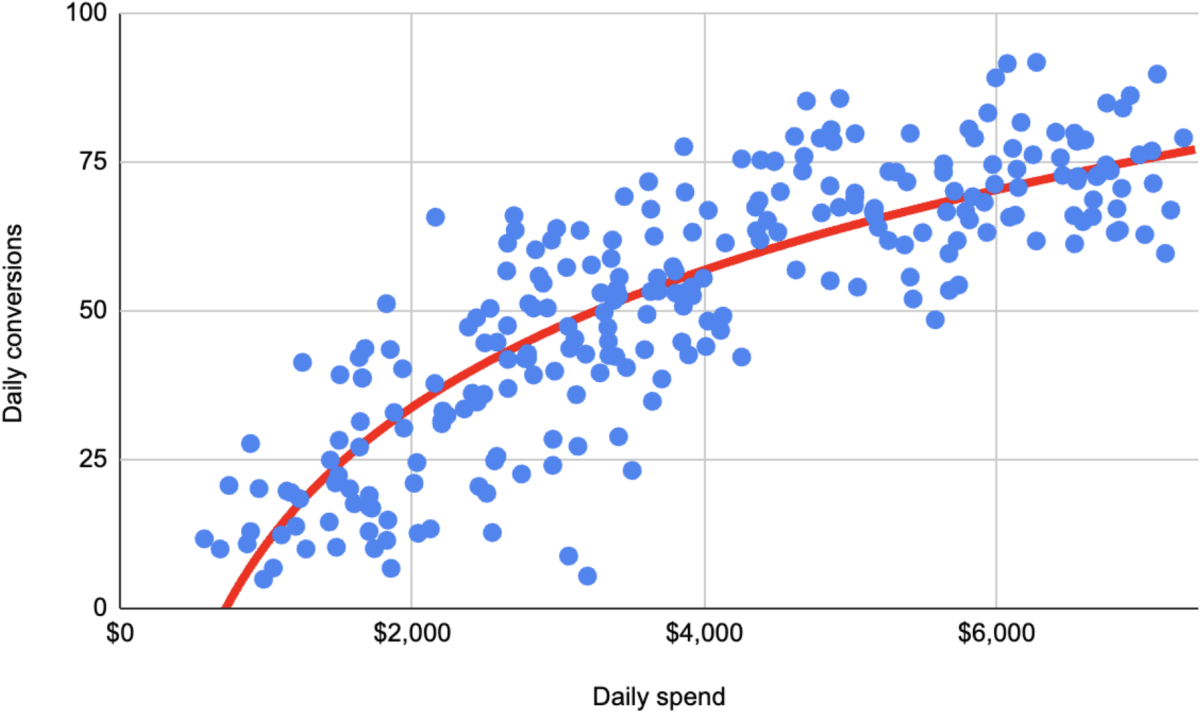
To demonstrate the power of this strategy, let’s take a step-by-step example using an optimized PPC account. Although all the PPC data below comes from a real business, we’ll imagine that we’re selling $150 personal life rafts for InflataFish, our favorite fictional online seller of inflatable fishing boats.

In the chart below, each dot represents the daily ad spend and number of life rafts sold in a six-month period.

We can model this account mathematically using regression analysis, a statistical technique that helps us understand relationships between variables, determine correlations within a data set, and make predictions accordingly. (Businesses often use regression analysis to optimize pricing, forecast sales, or make decisions based on historical trends.)
In this case, regression analysis gives us the following relationship—the red line—between ad spend and sales.
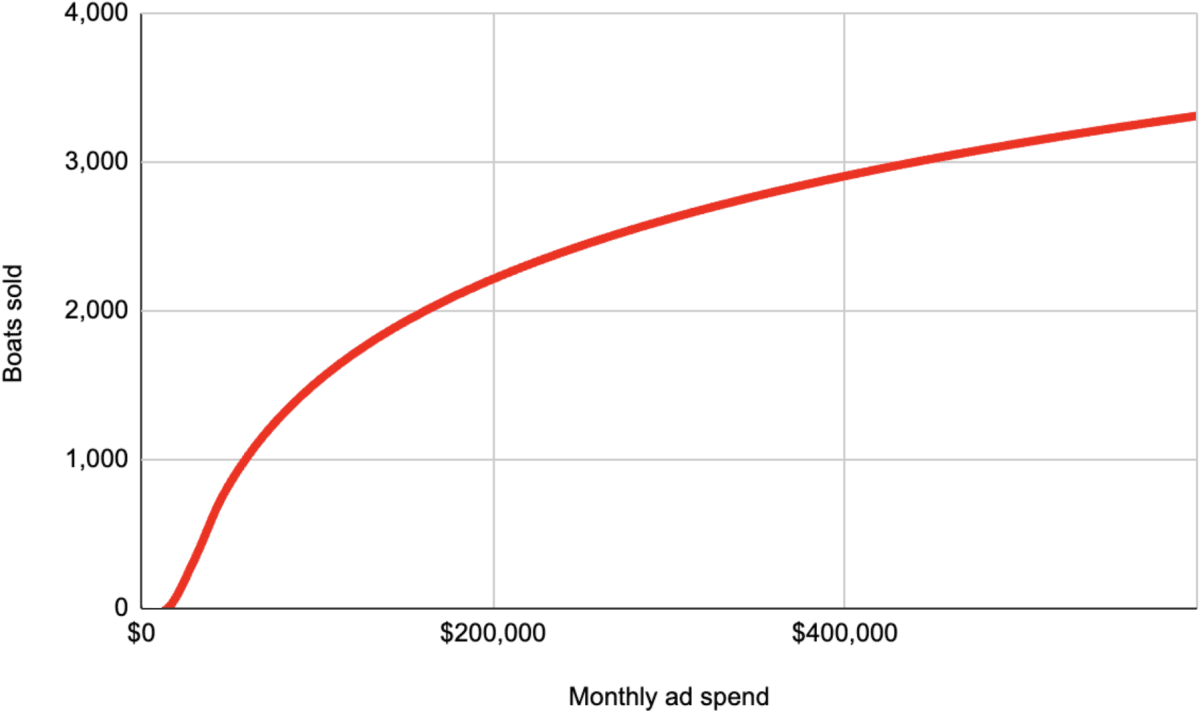
We can also convert that data from daily to monthly. The following graph shows monthly ad spend versus life rafts sold.
If we divide the ad spend by the units sold we get the cost per unit sold, or the cost per sale—which we can also plot against the ad spend (below).

Although there’s some fluctuation at the start of both charts (smaller budgets deliver more volatile results), the graphs provide a simplified model that we can use for our analysis.
In an optimized ad account—ignoring external factors—InflataFish is entirely constrained by this line. The line is their whole world. All they can do is decide where they want to live on it and adjust their ad spend accordingly.

How does InflataFish decide what they want to spend? One rational answer is to increase their ad budget until they reach their allowable cost per sale.
The allowable cost per sale is the maximum amount you can afford to spend on acquiring a customer while still maintaining an acceptable level of profitability. It’s calculated from factors like profit margin, overheads, and customer lifetime value.
Let’s say that the allowable cost per sale of life rafts is $90. It makes sense for InflataFish to increase its ad budget until that threshold is reached.


So for this account, InflataFish spends $195,000 a month on ads, selling 2,190 life rafts.
At $150 each, that’s $328,500 in sales for the InflataFish, or a Net Revenue from ads of $133,500.
What happens if we double the conversion rate?
Let’s say that InflataFish’s marketing team has read The Power Law of CRO or our related article—How much are you overspending on paid advertising? They launch a CRO program to optimize their landing page and funnel, and double their conversion rate. How would our model change?
First—the obvious. A doubled conversion rate delivers double the sales for a given ad spend, so we double the number of life rafts sold to 4,380.

InflataFish’s sales have increased to $657,000 for the same ad spend.
But what’s most interesting—and profound—is that the conversion rate increase has halved the cost per sale. (Double the sales for the same budget equals half the cost.) Which means we could now increase our ad spend significantly (the orange line below) before we reach the allowable cost per sale.
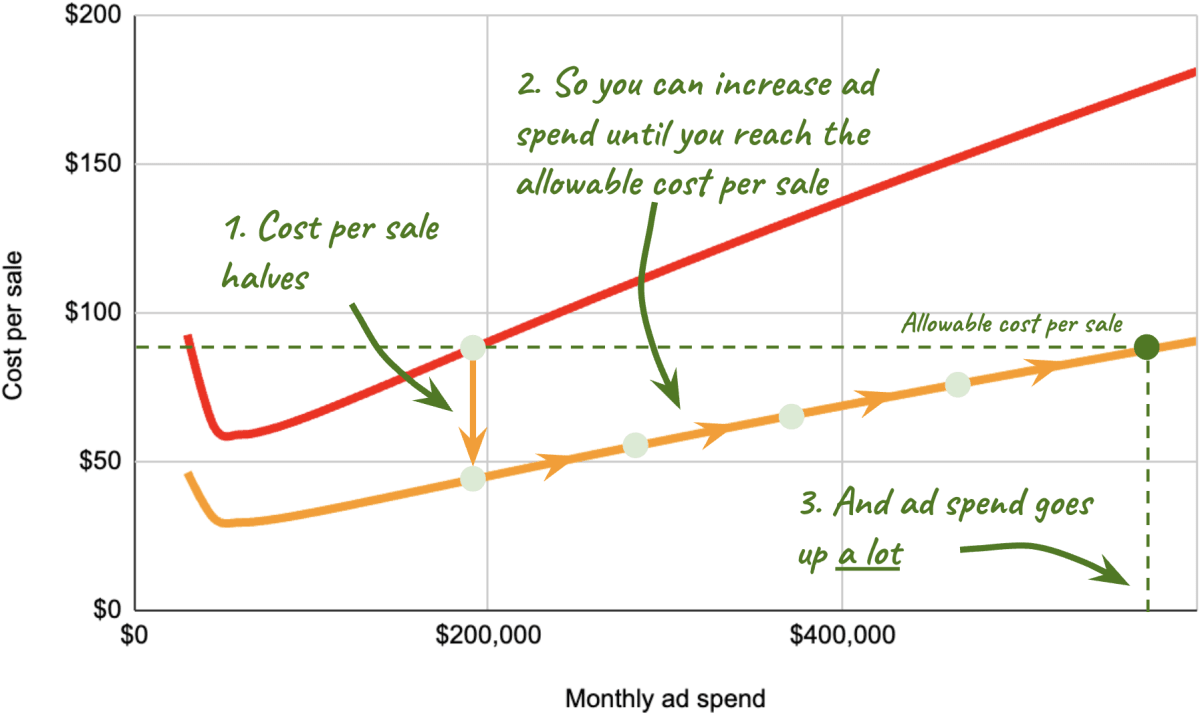
By increasing ad spend until we reach the original allowable cost per sale, ad spend and sales increase dramatically.

InflataFish is now selling 6,572 life rafts per month. At $150 each, that’s $985,800 in sales, with a net revenue from ads of $400,800.
In summary:
- Doubling the conversion rate doubles sales, which in turn…
- …halves the cost per sale, meaning we can…
- …raise ad spend until we hit the allowable cost per sale, which…
- …increases sales dramatically.
Let’s summarize the before and after numbers for InflataFish.
| Item | Before | After Doubled conversion rate + Increased ad spend |
| Units sold per month | 2,190 | 6,572 |
| Monthly sales | $328,500 | $985,800 |
| Monthly ad spend | $195,000 | $585,000 |
| Net revenue from ads | $133,500 | $400,800 |
And these sales increases aren’t happening in a vacuum.
InflataFish is now taking traffic and sales away from its key competitors (FloatFish and TackleTubes). Economies of scale mean that it can further reduce its allowable cost per sale, taking even more market share and increasing its dominance over the space.
Many of our clients find that CRO also unlocks marketing opportunities that were previously prohibitively expensive, giving them access to loads of new customers.
Why it pays to reinvest in traffic to grow market share
Increasing your conversion rate creates a more efficient sales machine, which in turn allows you to outbid PPC competitors and (profitably) grow your overall share of the market. When we worked with Money.co.uk, we used this exact principle to drive their growth.
This graph shows how they were able to increase their ad spend over time, which increased both their sales and market share.

And as Money.co.uk’s sales machine became ever more efficient, they were able to further expand into new markets and new channels. Here’s Chris again.
“The improved conversion rate even allowed us to enter new markets and expand into high-cost advertising channels like TV. TV is very expensive, but the better we can convert visitors, the more affordable this kind of advertising becomes.”
Companies—like Money.co.uk—that combine a dedicated CRO program with PPC advertising aren’t just increasing their sales; they are increasing their ability to further increase their sales.
The conversion rate gains from CRO reduce their cost per sale, allowing them to increase their ad spend, grow their share of the pie and, in many cases, dominate their market.
Model your numbers with a FREE strategy session
If you run PPC ads, the strategy above can supercharge your profits and market position. To model your own numbers, book a free (no obligation) strategy session, and let us show you what they could look like.
If you’re investing in paid traffic, it’s never too soon to start.
How much did you like this article?
What’s your goal today?
1. Hire us to grow your company
We’ve generated hundreds of millions for our clients, using our unique CRE Methodology™. To discover how we can help grow your business:
- Read our case studies, client success stories, and video testimonials.
- Learn about us, and our unique values, beliefs and quirks.
- Visit our “Services” page to see the process by which we assess whether we’re a good fit for each other.
- Schedule your FREE website strategy session with one of our renowned experts.
Schedule your FREE strategy session
2. Learn how to do conversion
Download a free copy of our Amazon #1 best-selling book, Making Websites Win, recommended by Google, Facebook, Microsoft, Moz, Econsultancy, and many more industry leaders. You’ll also be subscribed to our email newsletter and notified whenever we publish new articles or have something interesting to share.
Browse hundreds of articles, containing an amazing number of useful tools and techniques. Many readers tell us they have doubled their sales by following the advice in these articles.
Download a free copy of our best-selling book
3. Join our team
If you want to join our team—or discover why our team members love working with us—then see our “Careers” page.
4. Contact us
We help businesses worldwide, so get in touch!
© 2026 Conversion Rate Experts Limited. All rights reserved.
A Brandwidth Group Company.